

Walk the Block With a Notebook
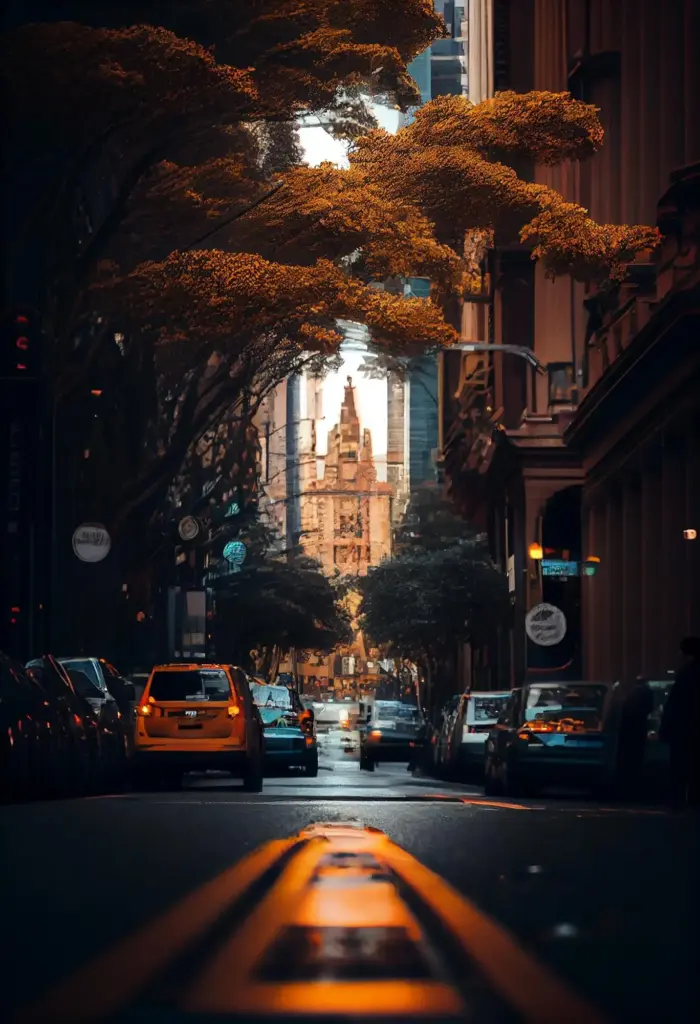
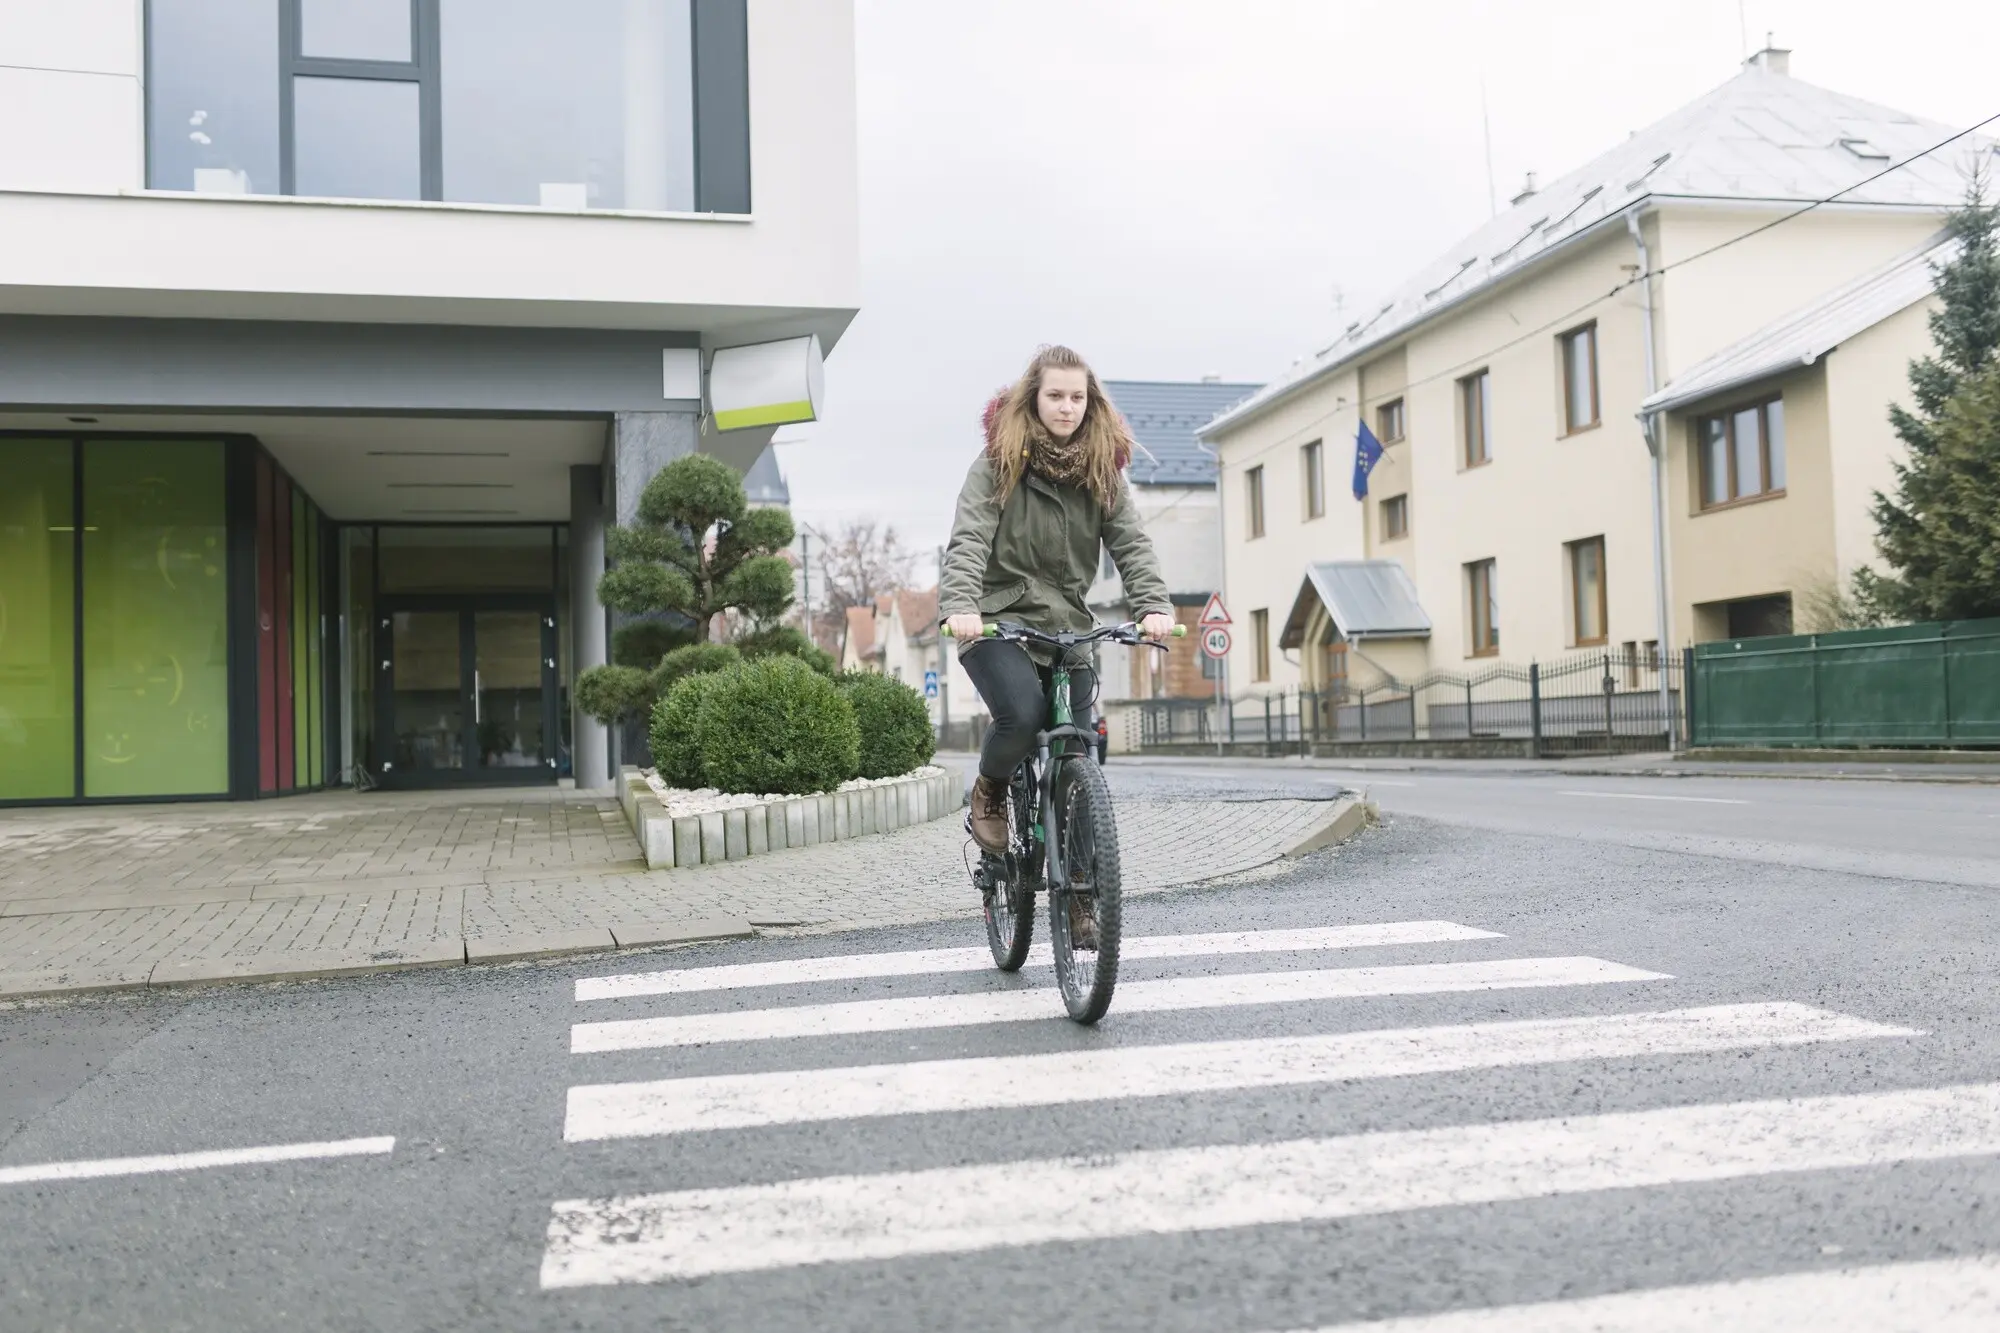
Trace the same route end to end, recording sidewalk cracks, litter hotspots, obstructed sightlines, burnt-out bulbs, and driver speeds using simple ticks and timestamps. Note segment lengths and landmarks. Photographs at fixed angles anchor observations, while a two-person team improves accuracy without adding cost.
Community Snapshots That Matter
Gather five-question intercept surveys at bus stops and corner stores, covering perceived safety, wayfinding clarity, lighting quality, and walking comfort. Translate questions plainly, offer sticker tokens, and track time of day. These tiny, respectful conversations reveal patterns stronger than any spreadsheet alone.

Open Data You Already Have
Pull 311 requests, crash reports, streetlight outage logs, and transit ridership by stop. Export CSVs, filter to your blocks, and mark duplicates. Even if imperfect, these sources provide anchors for trend lines and help validate what residents already feel daily.


Resident Diaries and Voice Notes
Invite a few regular walkers, elders, or students to record short audio notes about their trips. Ask about time saved, stress, and detours avoided. These intimate, time-stamped reflections pair beautifully with numbers and often reveal maintenance needs sooner than surveys.

Photo Pairs Tell the Story
Shoot from the same spot, height, and angle before and after. Include a watch or newspaper to mark the date. Side-by-side images document cleanliness, lighting uniformity, and driver behavior queues in ways spreadsheets cannot, while remaining inexpensive and instantly shareable online.
Mini-Interviews at the Corner
Stand near the upgraded location, invite passersby to chat for two minutes, and jot quotes verbatim. Rotate times to capture shift workers and students. Posting anonymized highlights with charts builds trust and reveals context behind spikes or dips in your graphs.